Line chart
Best for movement over time, trend shifts, and before versus after comparisons.
Use Chart to Video to create animated chart video for reports, social clips, and transparent overlays, then export MP4 deliverables or WebM alpha assets.
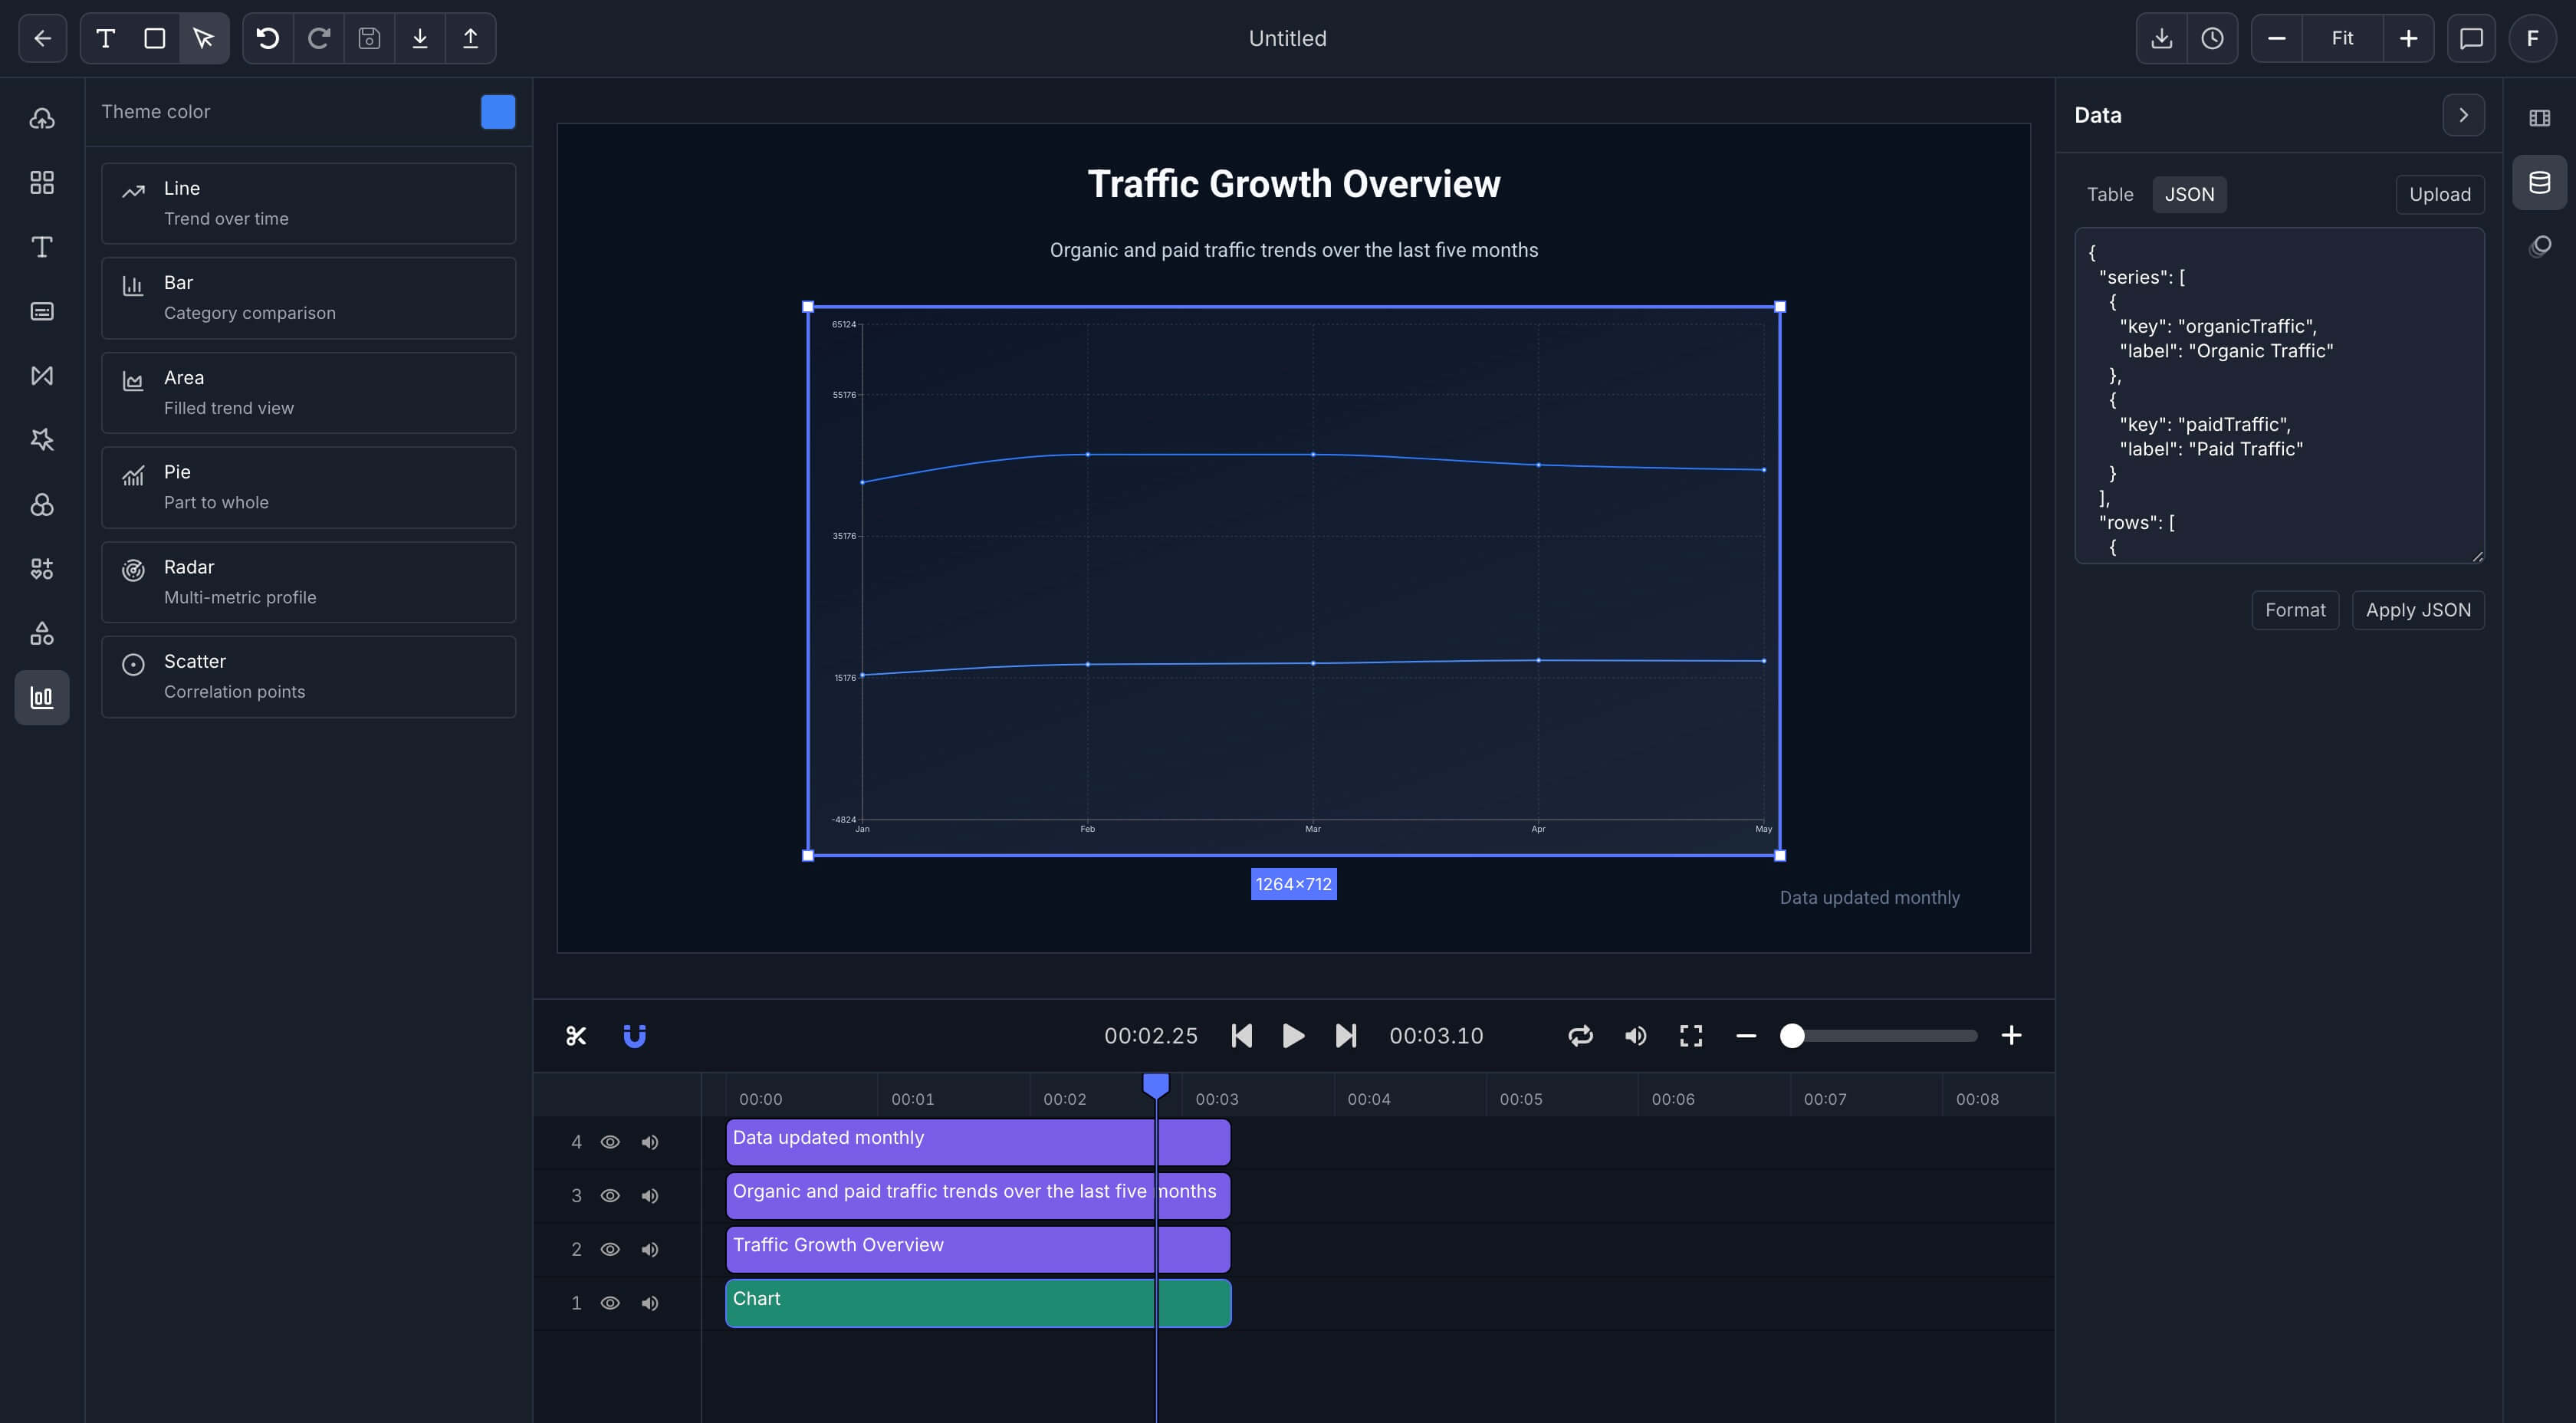
Chart to Video serves two common jobs. One is turning data into a finished chart video for reports or posts. The other is exporting Chart to Video motion as an overlay for another edit.
Best for
Analysts turning dashboard charts into stakeholder video
Creators publishing chart led explainers and stat posts
Editors who need chart overlays with transparent background
Teams that want one chart setup for both report video and social distribution
Best for movement over time, trend shifts, and before versus after comparisons.
Best for ranked categories, quick side by side comparison, and fast short form storytelling.
Best for cumulative movement, total volume, and stacked growth narratives.
Best for share based breakdowns where the audience needs composition at a glance.
Best for multi dimensional comparison when a single number does not tell the full story.
Best for outliers, clusters, and relationships between two variables that need visual context.
Open Chart to Video, then bring in a small table, report export, spreadsheet, or structured chart dataset with the values and labels you need.
Pick the Chart to Video chart type, adjust colors and labels, add captions or headline text, and frame the chart for the audience and channel.
Render Chart to Video as MP4 for a finished video or WebM when the chart needs to sit as a transparent graphic on top of another edit.
Chart to Video can end as a complete video or as a transparent motion layer, based on where the chart will be published.
Use Chart to Video MP4 for reports, presentations, and social uploads where the chart video is already the full deliverable.
Use WebM with alpha when the chart needs to float over a host video or slide into a separate edit timeline.
Use custom width and height when the chart needs to fit a product surface, sponsor placement, or presentation system.
One Chart to Video setup for reports, social clips, and overlay exports.
Six chart types that can be reused with new values instead of rebuilt from zero.
Text, captions, and chart styling in the same export system.
Custom output dimensions for product surfaces and sponsor placements.
WebM alpha for reusable chart motion inside larger edits.
Reusable Chart to Video templates for weekly reports, social series, and presentation graphics.
Use Chart to Video for KPI recaps, leadership updates, and client performance reporting.
Use Chart to Video motion for stat based hooks, rankings, and trend explainers built for feed speed.
Use chart motion as a transparent layer that can sit on top of footage in another project.
Use structured chart scenes when data needs to be rendered in a repeatable backend process.
Start Chart to Video with a chart template, choose the right export path, and publish an asset that fits reports, feeds, or overlays.
See the report oriented path for KPI summaries and stakeholder updates.
See the short form social path for rankings, trends, and stat based hooks.
See how chart scenes fit into structured and programmatic export.